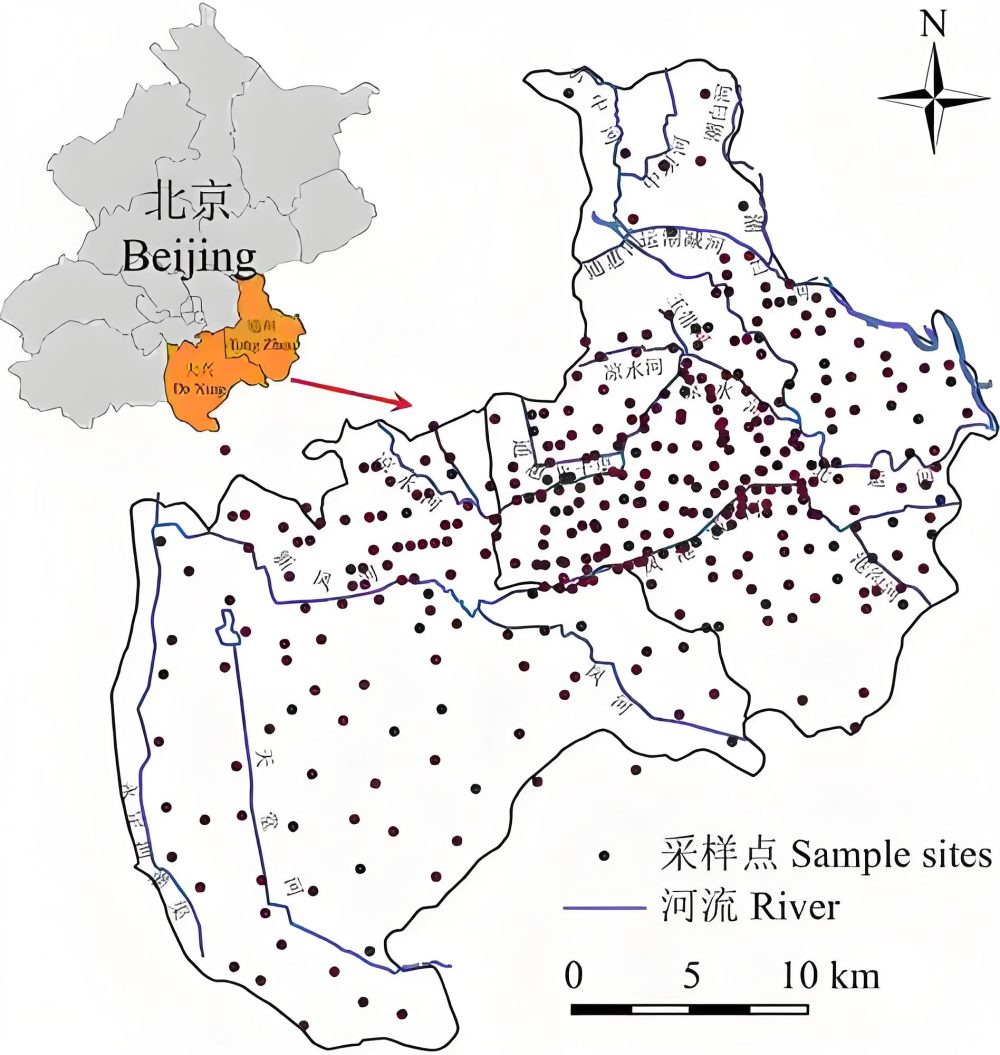
# 绘制采样点分布图 version2
# by Jinlong Zhang
# jinlongzhang01@gmail.com

setwd("C:/Users/admin/Desktop/map")
# 请根据用户名设定工作路径

#### 导入所需要的程序包
library(sf)
## Linking to GEOS 3.9.0, GDAL 3.2.1, PROJ 7.2.1
library(tmap)
library(tmaptools)
library(sp)
library(readxl)
library(grid)

rm(list = ls())

## 读取地图
country  <- read_sf("bou2_4l.shp")
# 设定投影
st_crs(country) <- CRS("+proj=longlat +datum=WGS84")


sites <-
  read_excel("location.xlsx")
# 编辑location.xlsx文件,给出采样点,注意经纬度不要颠倒
head(sites)
## # A tibble: 3 x 3
##   name_location longitude latitude
##   <chr>             <dbl>    <dbl>
## 1 Beijing            116.     39.9
## 2 Guangzhou          113.     23.1
## 3 Harbin             127.     45.8
coordinates(sites) <- ~ longitude + latitude
proj4string(sites) <- CRS("+proj=longlat +datum=WGS84")

# 地图
map1 <-
  tm_shape(country, # 经度范围
           ylim = c(18, 54), xlim = c(70, 140)) +
  tm_lines(col = "darkgrey", lwd = 1) +

  tm_layout(
    title = "Sampling sites",
    legend.position = c("left", "bottom"),
    inner.margins = c(0.12, 0.03, 0.08, 0.03)
  ) +
  tm_shape(sites) +
  tm_symbols(
    # 绘制采样点
    shape = 19,
    col = "red",
    scale = 0.6,
    border.col = NA,
    title.shape = "Sampling Sites",
    text = "name_location",
    legend.col.show = TRUE
  ) +
  # 显示采样点地名
  tm_text(text = "name_location",
          just = "bottom", size = 0.8) +
  # 添加经纬网
  tm_graticules(x = c(80, 90, 100, 110,
                      120, 130, 140),
                y = c(0, 10, 20, 30,
                      40, 50),
                lwd = 0.5, col = "lightgrey") +
  # 指北针
  tm_compass(type = "arrow",
           position = c("left", "top")) +
  # 比例尺
  tm_scale_bar(position = c("left", "bottom")) +
  # 横轴
  tm_xlab("Longitude", size = 1) +
  # 纵轴
  tm_ylab("Latitude", size = 1)


# 南海诸岛小地图
map2 <-
  tm_shape(country,
           xlim = c(105, 122), # 经度范围
           ylim = c(2, 25)) +  # 纬度范围
  tm_lines(col = "darkgrey", lwd = .8) +
  tm_layout(inner.margins = c(0.12, 0.03, 0.08, 0.03)) +
  tm_shape(sites) +
  tm_dots(
    shape = 19,
    col = "red",
    scale = 3,
    border.col = NA
  ) +
  tm_text(text = "name_location", just = "bottom",
          size = 0.5) # 显示采样点地名

# 保存为6英寸大小的pdf文件
# pdf("sampling_sites.pdf", width = 6, height = 6)
print(map1)
print(map2, vp = viewport(0.90, 0.25, width = 0.3, height = 0.25))

# dev.off()


# 保存为6英寸的tiff文件,lzw压缩,分辨率600dpi
# tiff(
#   "sampling_sites.tiff",
#   width = 3600,
#   height = 3600,
#   res = 600,
#   compression = "lzw"
# )
# print(map1)
# print(map2, vp = viewport(0.90, 0.35, width = 0.3, height = 0.25))

# dev.off()